> For the complete documentation index, see [llms.txt](https://docs.annoto.net/guides/llms.txt). Markdown versions of documentation pages are available by appending `.md` to page URLs; this page is available as [Markdown](https://docs.annoto.net/guides/annoto-dashboard/insights/user-view.md).

# User View

{% hint style="success" %}
These analytics can provide insights that can be used for grading, for identifying at-risk learners and for getting a general idea of what is the progress of each of the learners in the course.
{% endhint %}

Accessing the User View is done when clicking on a user's row in the Users Activity table in the Course view. The user view dives into the user and presents their activity throughout the course.&#x20;

## Overview

‌The overview section presents aggregated analytics regarding the activity of this user in all course videos.&#x20;

The Overview includes a completion funnel as well as the user's videos consumption in the course.&#x20;

### Course Completion Funnel

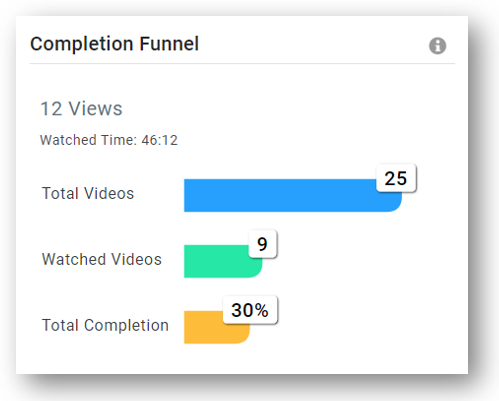
The completion funnel sheds light on the user's total activity in the course

<figure><img src="https://566050748-files.gitbook.io/~/files/v0/b/gitbook-x-prod.appspot.com/o/spaces%2F-LyZZ-Rd8ZeUw4DKgY2O%2Fuploads%2FihvI6O7Nxrc88N9ifvw7%2Fimage.png?alt=media&amp;token=a0eb5313-883a-4ebf-9341-4f2ba8cd20b3" alt=""><figcaption><p>Illustration: A user's completion funnel</p></figcaption></figure>

* **Views** - Number of times the user  viewed videos in this course. For more details please refer to [How Views are counted](/guides/annoto-dashboard/faq.md#how-views-are-counted).
* **Watched Time** - total number of seconds the user has watched in the course (for all course videos).
* **Total Videos** - Number of videos in the course.
* **Watched Videos** - Number of videos viewed by the user.
* **Total Completion** - sum of [Total Completion](/guides/annoto-dashboard/faq.md#what-is-total-completion-average-completion-rate-watch-time-and-why-should-i-care) of *Watched Videos* divided by number of videos in the course (how much of the course videos the user has finished watching).

### Video Consumption

The video metrics (on the right of the Course Video Completion Funnel), provide insights on the user's video consumption habits.

<figure><img src="https://566050748-files.gitbook.io/~/files/v0/b/gitbook-x-prod.appspot.com/o/spaces%2F-LyZZ-Rd8ZeUw4DKgY2O%2Fuploads%2FOPaGsu64G2U2EPCnSrzm%2Fimage.png?alt=media&amp;token=a32dda41-234d-452c-a160-7b75b52c90a7" alt=""><figcaption><p>Illustration: A user's videos consumption</p></figcaption></figure>

* **Average Completion Rate -**&#x53;um of percent watched in each view session divided by number of views. This metrics helps answer the question of how well the user performs in terms of dropout.
* **Average Total Completion** - Average Total Completion of all the watched videos. Total Completion is aggregated video completion for all view sessions (video coverage).
* **Average Watch Time** - Average Watch Time of all the videos. Watch Time is aggregated number of seconds watched in all view sessions.

A "perfect" watching experience would be indicated by an equilateral triangle (all edges should be the same, and as close to 100% as possible).&#x20;

If one of the edges is significantly longer - you may want to pay attention to the user.

For example - In the Video Consumption image above:&#x20;

The Avg. Watch Time is 248%, meaning: on average, the learner watched the videos in the course more than x2 of their duration.

&#x20;The Avg. Completion Rate is 2%, meaning: on average, every time the user played a video, this user watched only 2% of it (the user watched only a bit of the video every time they played it).

The Avg. Total Completion is 79%, meaning: on average, the user covered 79% of each video in the course.

{% hint style="info" %}
Recommended further reading: [How to better Understand the Users by using Participation and Engagement Metrics?](/guides/annoto-dashboard/best-practices.md#how-to-better-understand-the-users-by-using-participation-and-engagement-metrics)
{% endhint %}

### Activity Metrics

In addition, we can find the aggregated activity metrics made by the user in the course:

<figure><img src="https://566050748-files.gitbook.io/~/files/v0/b/gitbook-x-prod.appspot.com/o/spaces%2F-LyZZ-Rd8ZeUw4DKgY2O%2Fuploads%2Fhmuj9kAqaps7piR6jy4O%2Fimage.png?alt=media&amp;token=3531be72-807b-4492-91b5-4c38dc3d0d55" alt=""><figcaption><p>Illustration: A user's course activity</p></figcaption></figure>

**Views** – Number of times videos were viewed in this course by the user. For more details, please refer to How Views are counted.

**Engagement** – Rating for user generated content creation and consumption for the course. For more details please refer to How engagement is measured.

**Collaboration** - Number of comments and replies the user has submitted in all course videos.

**Notes** - Number of personal notes the user has submitted in all course videos.

## Videos

The Activity in Course Videos table provides analytics about the user's activity in each video within the course.

<figure><img src="https://566050748-files.gitbook.io/~/files/v0/b/gitbook-x-prod.appspot.com/o/spaces%2F-LyZZ-Rd8ZeUw4DKgY2O%2Fuploads%2FGrfQ3qcx5awsUHCdg5Db%2Fimage.png?alt=media&amp;token=cc0ccb82-620f-4541-ab5d-dc31dd2181ef" alt=""><figcaption><p>Illustration: A user's activity in all course videos</p></figcaption></figure>

{% hint style="success" %}
The table can be sorted by each column to quickly find videos the user is most active on in the course by the selected category. For example: video the user is most engaged in, or video for which the user has the highest **or the lowest** Average completion rate, etc.
{% endhint %}

* **Last Activity** - Date when the user was last active in the video.
* **Views** - Number of times the user [viewed the video](/guides/annoto-dashboard/faq.md#how-views-are-counted).
* **Avg. Completion Rate** – Sum of percent watched in each view session divided by number of views. This metric provides user's dropout rate for each video.
* **Total Completion** – Aggregated video completion for all view sessions the user had (video coverage).&#x20;
* **Watch Time(%)** - Aggregated number of seconds the user has watched in all view sessions. The metric is shown in percentage [for convenience](/guides/annoto-dashboard/faq.md#how-to-see-watch-time-in-seconds).
* **Engagement** - User's score for [UGC](/guides/annoto-dashboard/faq.md#what-is-ugc) creation and consumption in this video. For more details please refer to [How engagement is measured](/guides/annoto-dashboard/faq.md#how-engagement-is-measured).
* **Collaboration** - Number of comments and replies the user added in the video.
* Replies - Number of times the user replied to a comment in the video.
* **Notes** - Number of personal notes.
* **Thumbs Up Badges** - Number of likes on comments the user received from Educators.
* **Duration** - Video duration.

{% hint style="success" %}
To learn more about completion metrics we highly recommend reading: [What is Total Completion, Average Completion Rate, Watch Time and why should I care?](/guides/annoto-dashboard/faq.md#what-is-total-completion-average-completion-rate-watch-time-and-why-should-i-care)
{% endhint %}

{% hint style="info" %}
Recommended further reading: [How to use tables sorting for better insights?](/guides/annoto-dashboard/best-practices.md#how-to-use-tables-sorting-for-better-insights)
{% endhint %}

## Activity Trends

<figure><img src="https://566050748-files.gitbook.io/~/files/v0/b/gitbook-x-prod.appspot.com/o/spaces%2F-LyZZ-Rd8ZeUw4DKgY2O%2Fuploads%2FF73aHCggZ65kLl6OxYKi%2Fimage.png?alt=media&amp;token=e641b5e6-ee77-4640-98a3-e589bac545df" alt=""><figcaption><p>Illustration: A user's activity trends</p></figcaption></figure>

{% hint style="success" %}
Recommended further reading: [Using the Activity Trends to Learn about Users Progress](/guides/annoto-dashboard/best-practices.md#using-the-activity-trends-to-learn-about-users-progress).
{% endhint %}

{% hint style="info" %}
Might also interest you: [How to use Activity Trends graph To](/guides/annoto-dashboard/faq.md#how-to-use-activity-trends-graph-toolbar)
{% endhint %}
